Operational ocean forecasting
The Met Office Forecasting Ocean Assimilation Model (FOAM; Martin et al., 2007) system provides operational analyses and 5-day forecasts of ocean temperature, salinity, currents and sea-ice on a daily basis. It assimilates Argo data as well as other data types including satellite altimeter sea surface height data and sea surface temperature data. The main aims are to analyse and forecast the mesoscale structure of the ocean and to use the analyses produced by FOAM to monitor the climate of the oceans. For both of these aims, the Argo data are crucial. The only data available which can directly resolve the dynamical structure at the mesoscale is the satellite altimeter sea surface height data. The method used to assimilate the altimeter data makes no changes to the water mass properties of the model and so the only way in which these can be altered is through direct assimilation of in situ profile data, such as from Argo.
Observing system experiments have been performed using the 1/9° resolution North Atlantic FOAM configuration: one in which all the available temperature and salinity data were assimilated, and one in which the Argo data were withheld from the assimilation. Both of these integrations were started from the same initial conditions on 7th January 2001 and run for 5 years. The average impact of the data on the model is shown in figure 1 for temperature and figure 2 for salinity, both at 1,000m depth. These figures show that with the Argo data included, there is a much larger impact on the model from the data assimilation. Without Argo data, the data assimilation is unable to constrain the salinity field in particular and also has a large impact on the analysed temperature. The overall root-mean-square errors from these integrations are presented in figure 3 which shows that the Argo array has a significant positive impact on the overall errors in the FOAM system. Without the Argo data the temperature errors are up to 40% larger and the salinity errors near the surface are over twice as large, even when the other in situ data sources are assimilated.
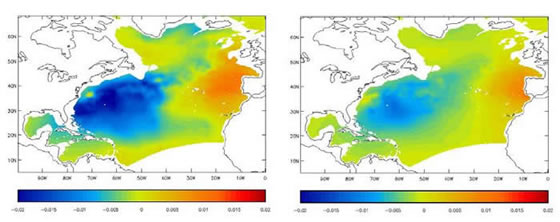
Figure 1: Average temperature changes (°C per day) made to the model by the data assimilation at 1,000m depth when (left) all data are assimilated and (right) all data except Argo profiles are assimilated.
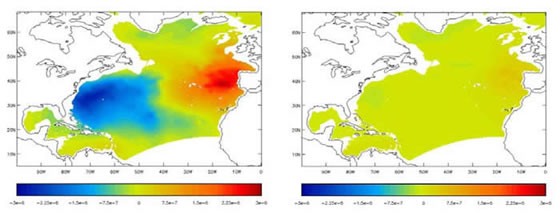
Figure 2: Average salinity changes (psu/1000 per day) made to the model by the data assimilation at 1,000m depth when (left) all data are assimilated and (right) all data except Argo profiles are assimilated.
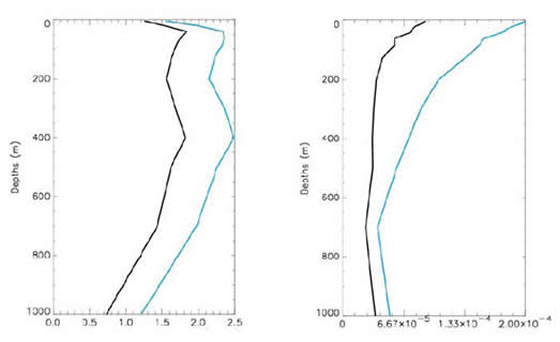
Figure 3: Root-mean-square errors as a function of depth over a 5-year reanalysis of the FOAM system for (left) temperature (°C) and (right) salinity (psu/1000). The black line shows the errors when all in situ data are assimilated, and the blue line shows the errors when all data except Argo data are assimilated.
See also the FOAM southern ocean animation and plots encorporating Argo data.