Using interannual variability in Argo to interpret changes between long sections observed decades apart - Gerard McCarthy
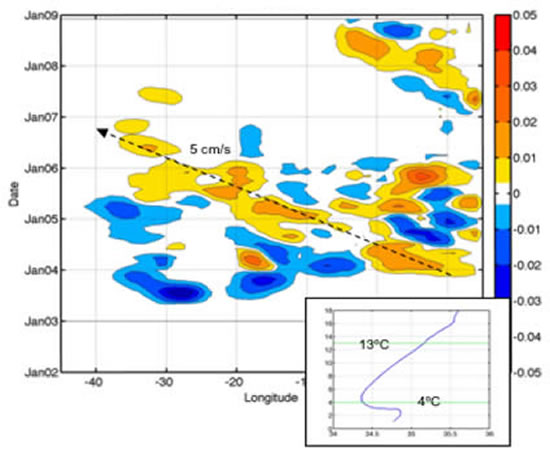
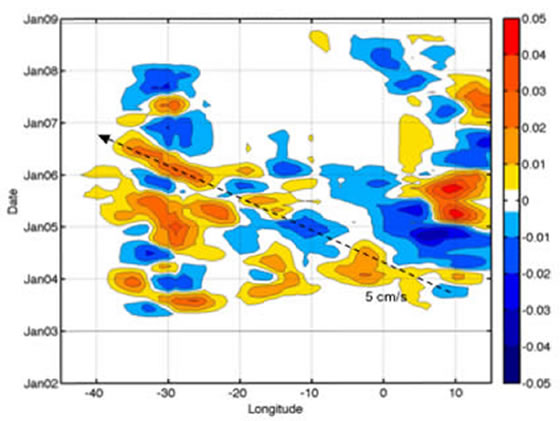
Objective mapping of salinity, at 30°S in the South Atlantic. Salinity is interpolated on the characteristic levels of two important water masses, at 13°C (thermocline water) and 4°C (intermediate water). The results are presented as salinity anomalies in longitude-time plots. The interannual variability near the eastern boundary in these water masses is of comparable magnitude to the changes seen between cruises completed ten years apart in 1993 and 2003, which must be a critical consideration when interpreting those cruise data.
Argo salinity anomaly across 30°S on 4°C isotherm.
Argo salinity anomaly across 30°S on 13°C isotherm